Opscompass examines your connected cloud resources for cybersecurity framework compliance. Each resource is evaluated using 'checks' (cloud, resource-type and configuration-specific evaluation criteria), and compared to the requirements of each framework. Results are reported in the Opscompass Compliance Module, the Opscompass Dashboard, and reported via report exports and the Opscompass API. Several compliance frameworks are supported, and Opscompass can quickly add new frameworks to suit your needs.
Compliance Dashboard
Opscompass features a compliance dashboard that provides access to frameworks, compliance changes over time, current compliant status, and an overview of your mitigations and exceptions. To reach the compliance dashboard, click the Compliance title in the left navigation pane.
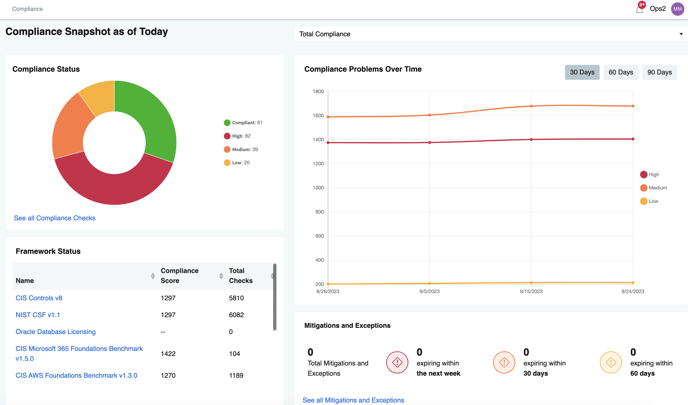
Compliance Status - The compliance status pie chart visualizes the number of compliance checks within each status group. You can also click on the status on the right to filter the pie chart.
Framework Status - The framework status data table shows all of your frameworks, their individual compliance scores, and the number of checks the framework has. Also, when you click on the framework name, you are taken to the detailed framework page.
Compliance Problems Over Time - This line chart shows how your compliance problems have changed over 30, 60, and 90 days. You can see if your compliance problems have gone up or down. You can also filter this line chart by clicking on the status to the right.
Mitigations and Exceptions - To keep track of mitigations and exceptions, there is a section to see how many are expiring in the near future.
Compliance Framework Page
The Compliance Framework page provides a convenient display for administrators looking to report on compliance problems relative to a specific compliance framework. This page lists the compliance framework name, the appropriate controls and sub-controls, and the status of checks within each control or sub-control.
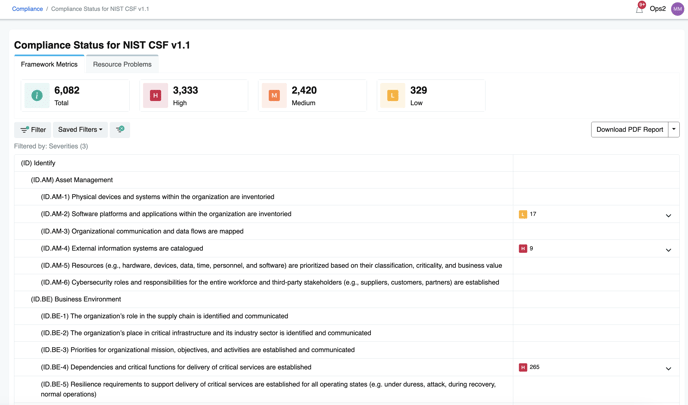
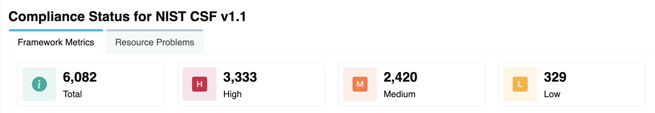
The totals row on the Compliance Framework page indicates different conditions depending on what information is most relevant.
- Framework Metrics - these figures indicate the number of checks that were evaluated for this framework. In this example, evaluating NIST CSF v1.1 for all included resources required 6,082 unique examinations, with 3,333 high severity check failures, 2,420 medium and 329 low. Clicking on any of the counts in the total bar filters the Compliance Framework view to only those checks.
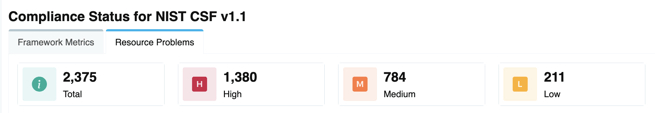
- Resource Problems indicates the count of resources with compliance check failures. Clicking on any of the counts in the total bar filters the Compliance Framework view to only those checks.
Clicking on a row in the framework opens the control to show the list of affected resources.
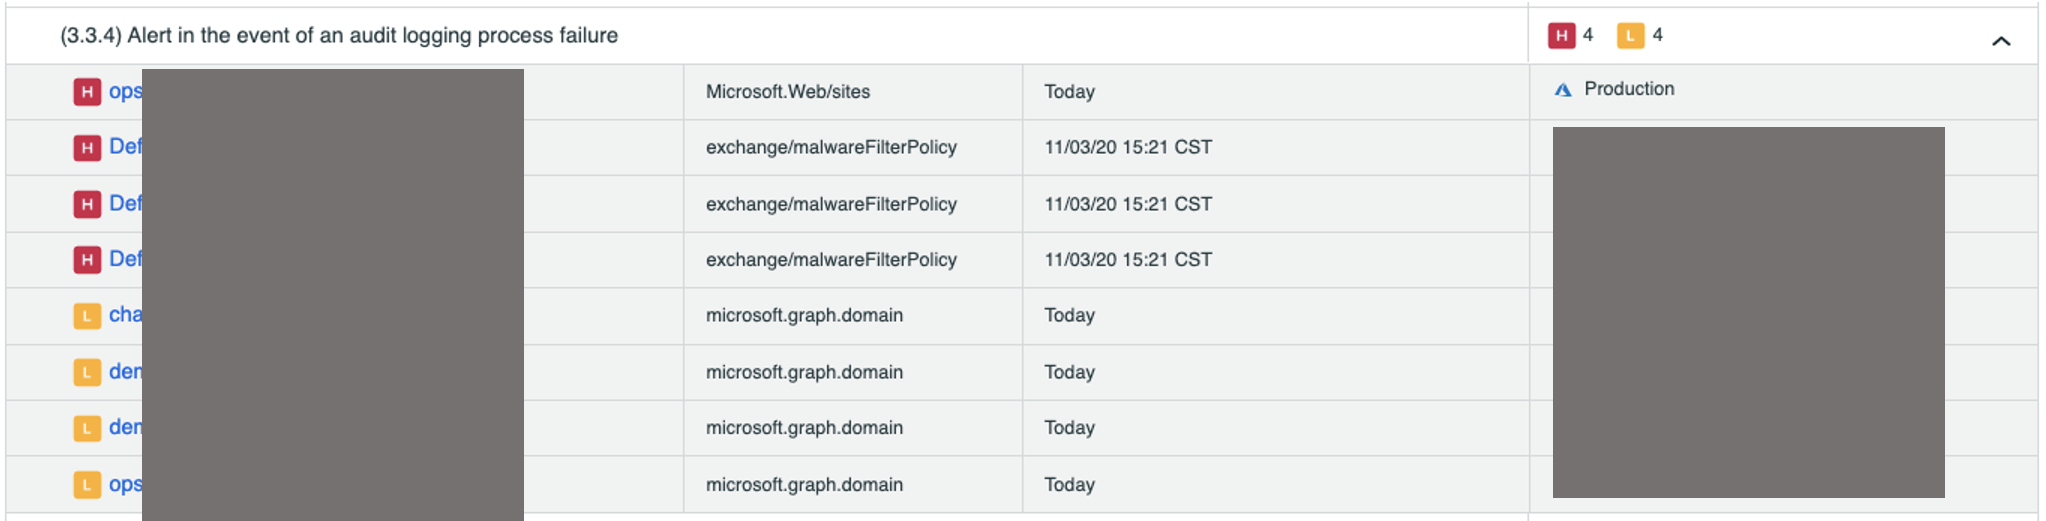
This view shows the name of the resource, the resource type, the last scan date, and the account membership. Each item in the list has a clickable link. Following the clickable link directs you to the Resource Page. More compliance check information is available.
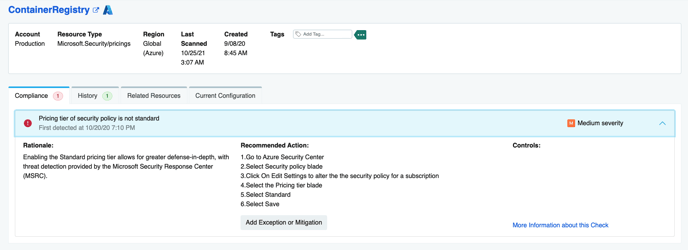
By selecting a specific failed check in the Resource Page, you can see the problem, the rationale, and the recommended actions. The Controls section illustrates all of the frameworks where a given check failure causes a violation report.
From this view, you can indicate an exception or mitigation for this particular check. You can also navigate to the specific Check Page to learn more about all the resources that are subjected to this check.